Access Across America: Transit 2020
Access to jobs by transit increased in 70% of largest U.S. metros
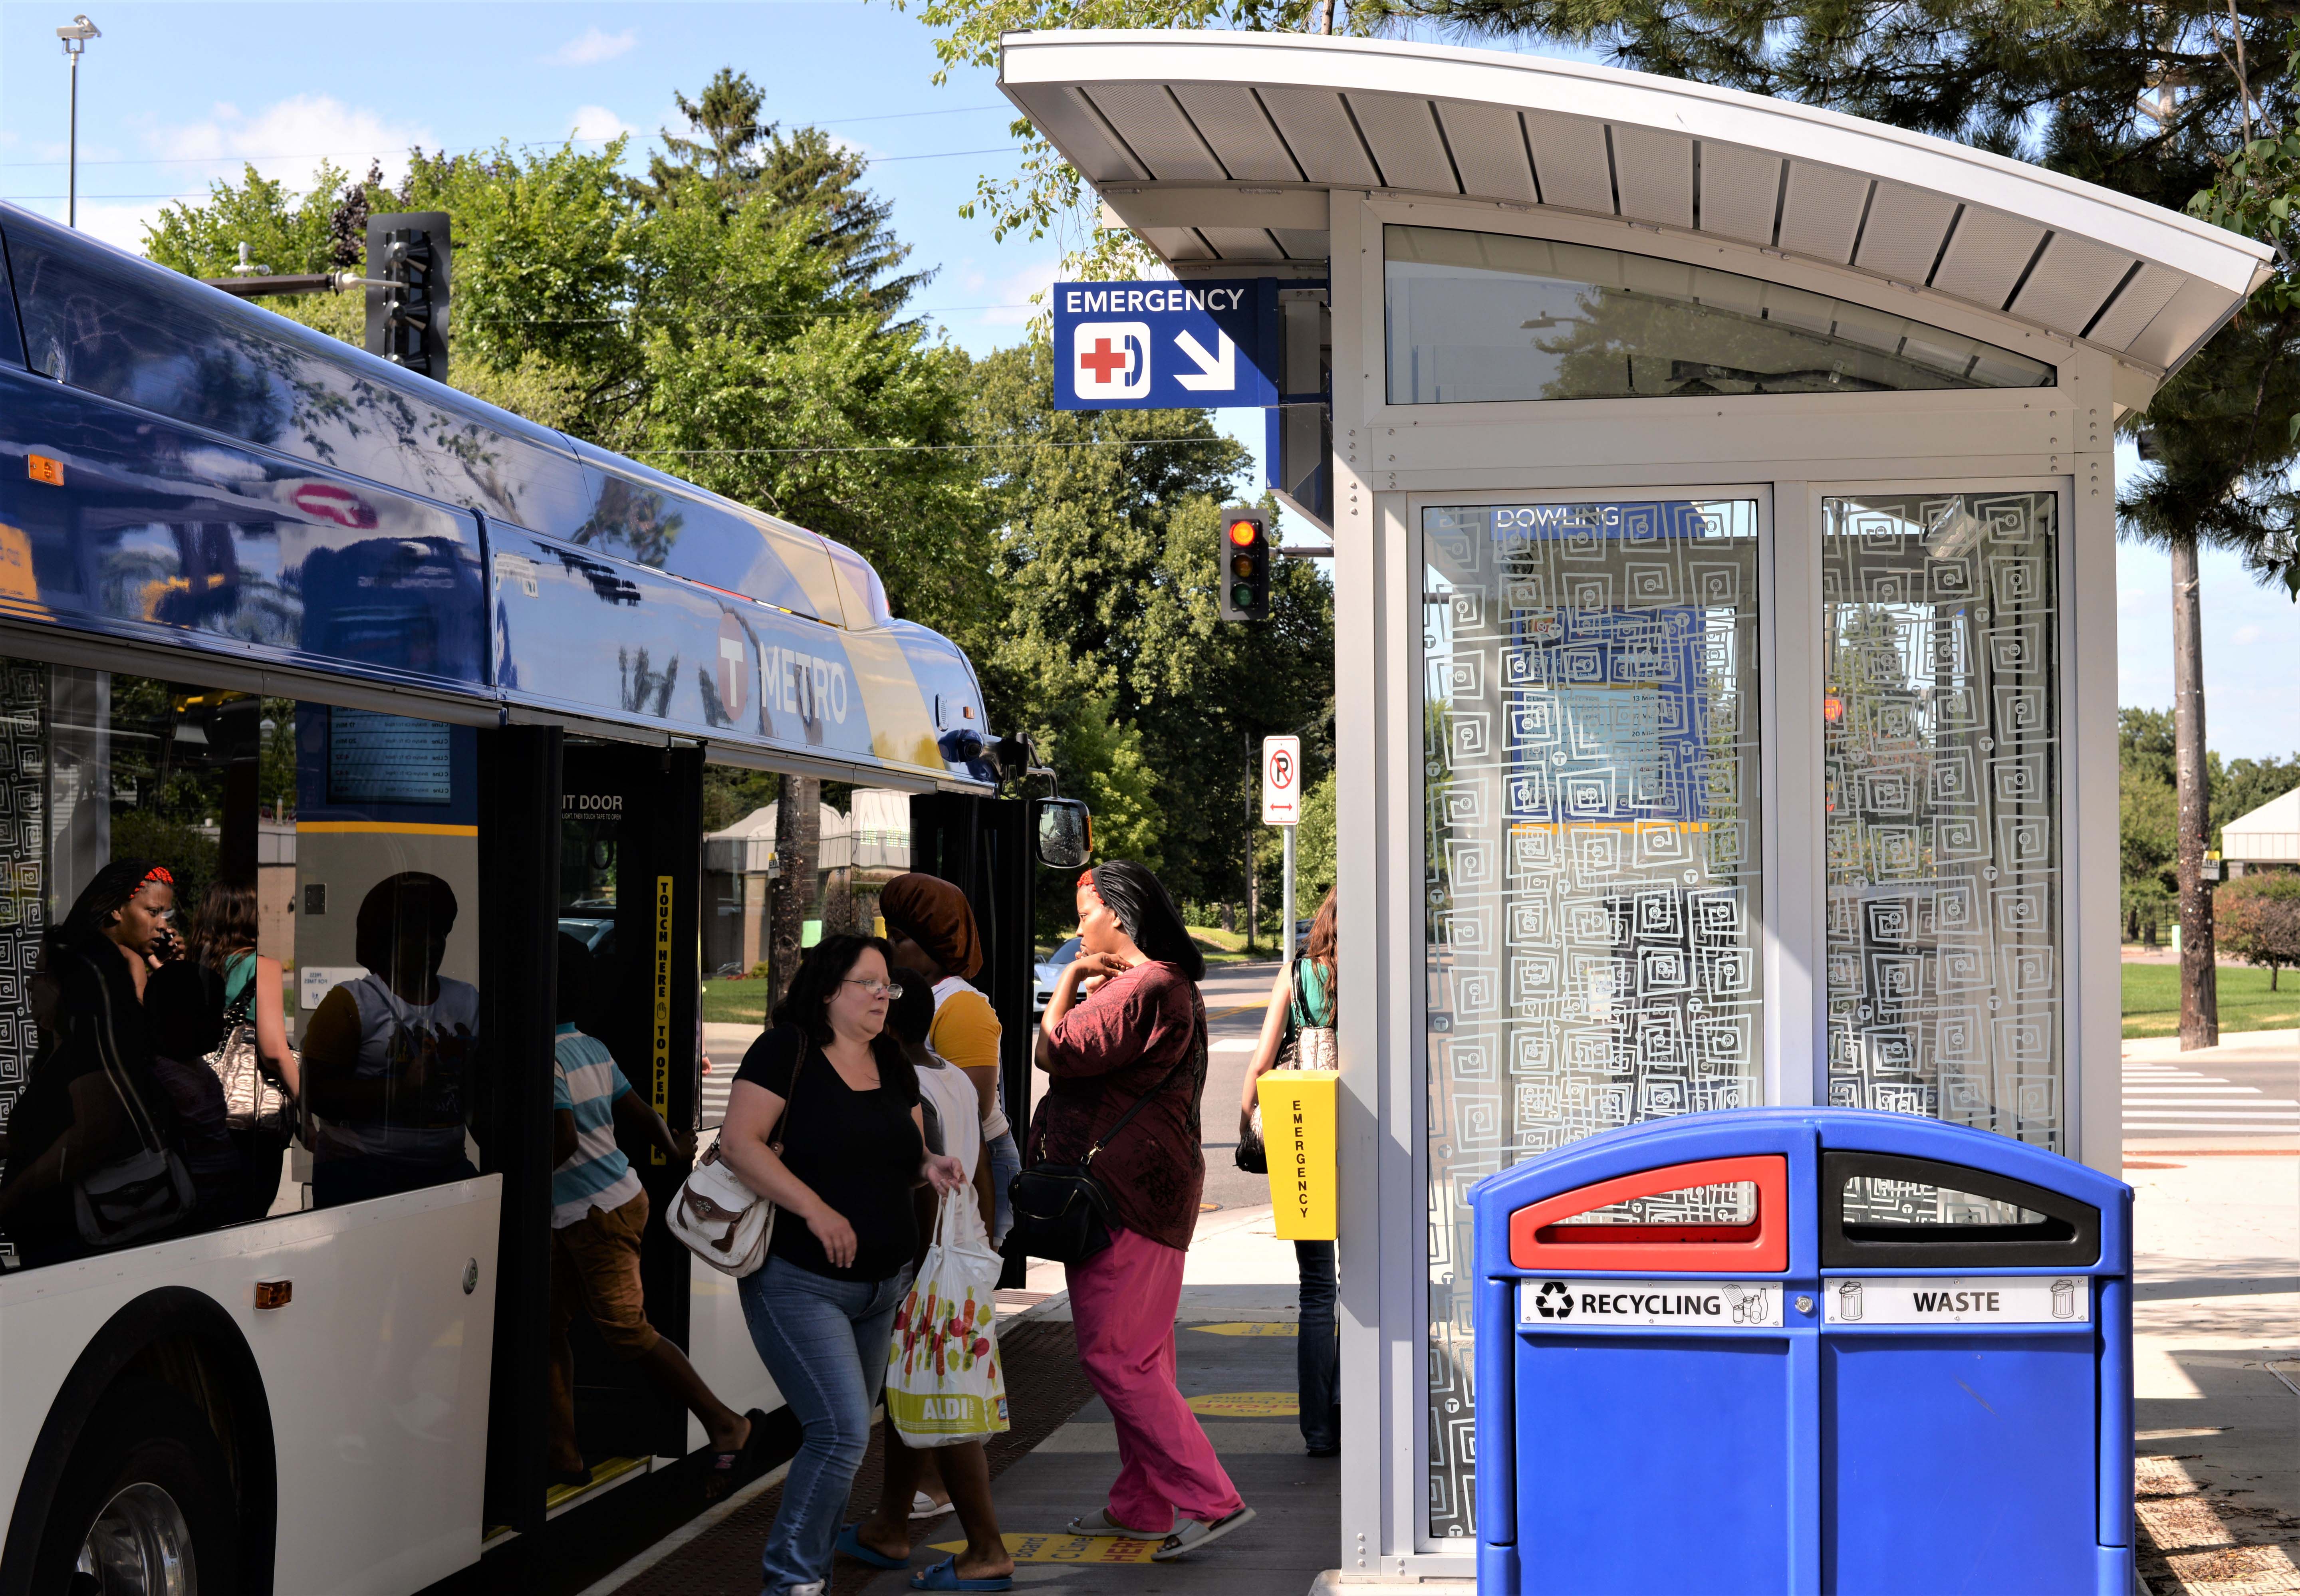
Photo: Metro Transit
Access Across America: Transit 2020 measures access to jobs by transit for each of the most populous U.S. metropolitan areas and also shows the change in accessibility for each metro since the previous year. Though rankings of the top 10 metro areas for job accessibility by transit changed little between the 2019 and 2020 studies, access to jobs by transit increased in 70% - 35 of the 50 largest U.S. metros.
With a 27% increase each, Nashville and Memphis topped the list of cities with the greatest changes in accessibility to jobs via transit. Nearly 7,100 jobs were accessible by a 30-minute transit trip in Nashville, with more than 6,000 accessible in Memphis.
Key factors affecting the rankings for any metro area include the number of jobs available and where they are located, the availability of transit service, and population size, density, and location.
Public transit is used for an estimated 5 percent of commuting trips in the United States, making it the second most widely used commute mode after driving.
This annual nationwide data is used to guide key transportation and land-use policy decisions. State departments of transportation, metropolitan planning organizations and transit agencies can apply the data to performance goals related to congestion, reliability and sustainability. In addition, detailed accessibility evaluation can help in selecting between project alternatives and prioritizing investments.
Data used in the 2020 edition of the report were collected almost entirely prior to the onset of the COVID pandemic and resulting changes in service provided by transit operators, as well as travel behavior changes. Because future editions will include data reflecting conditions at various points during the pandemic, the 2020 results may provide a useful baseline for evaluating the impact that COVID-19 had on transit access across America.
Accessibility to jobs via transit rankings
- New York
- San Francisco
- Chicago
- Washington, D.C.
- Los Angeles
- Boston
- Philadelphia
- Seattle
- Denver
- San Jose
Annual accesibility change rankings
- Nashville
- Memphis
- Washington, D.C.
- Austin
- Denver
- Virginia Beach
- Providence
- Tampa
- Buffalo
- Philadelphia
More information
The research was sponsored by the National Accessibility Evaluation Pooled-Fund Study, a multi-year effort led by the Minnesota Department of Transportation and supported by partners including the Federal Highway Administration and additional state DOTs.