Access Across America: Transit 2019
Access to jobs by transit increases in half of largest U.S. metros
Access Across America: Transit 2019 measures access to jobs by transit for each of the top 50 U.S. metropolitan areas and also shows the change in accessibility for each metro since last year. Though rankings of the top 10 metro areas for job accessibility by transit only changed slightly from the previous year, access to jobs by transit increased in half of largest U.S. metros. The data comparing changes within each of these metros helped researchers identify the places with the greatest increases in access to jobs by transit.
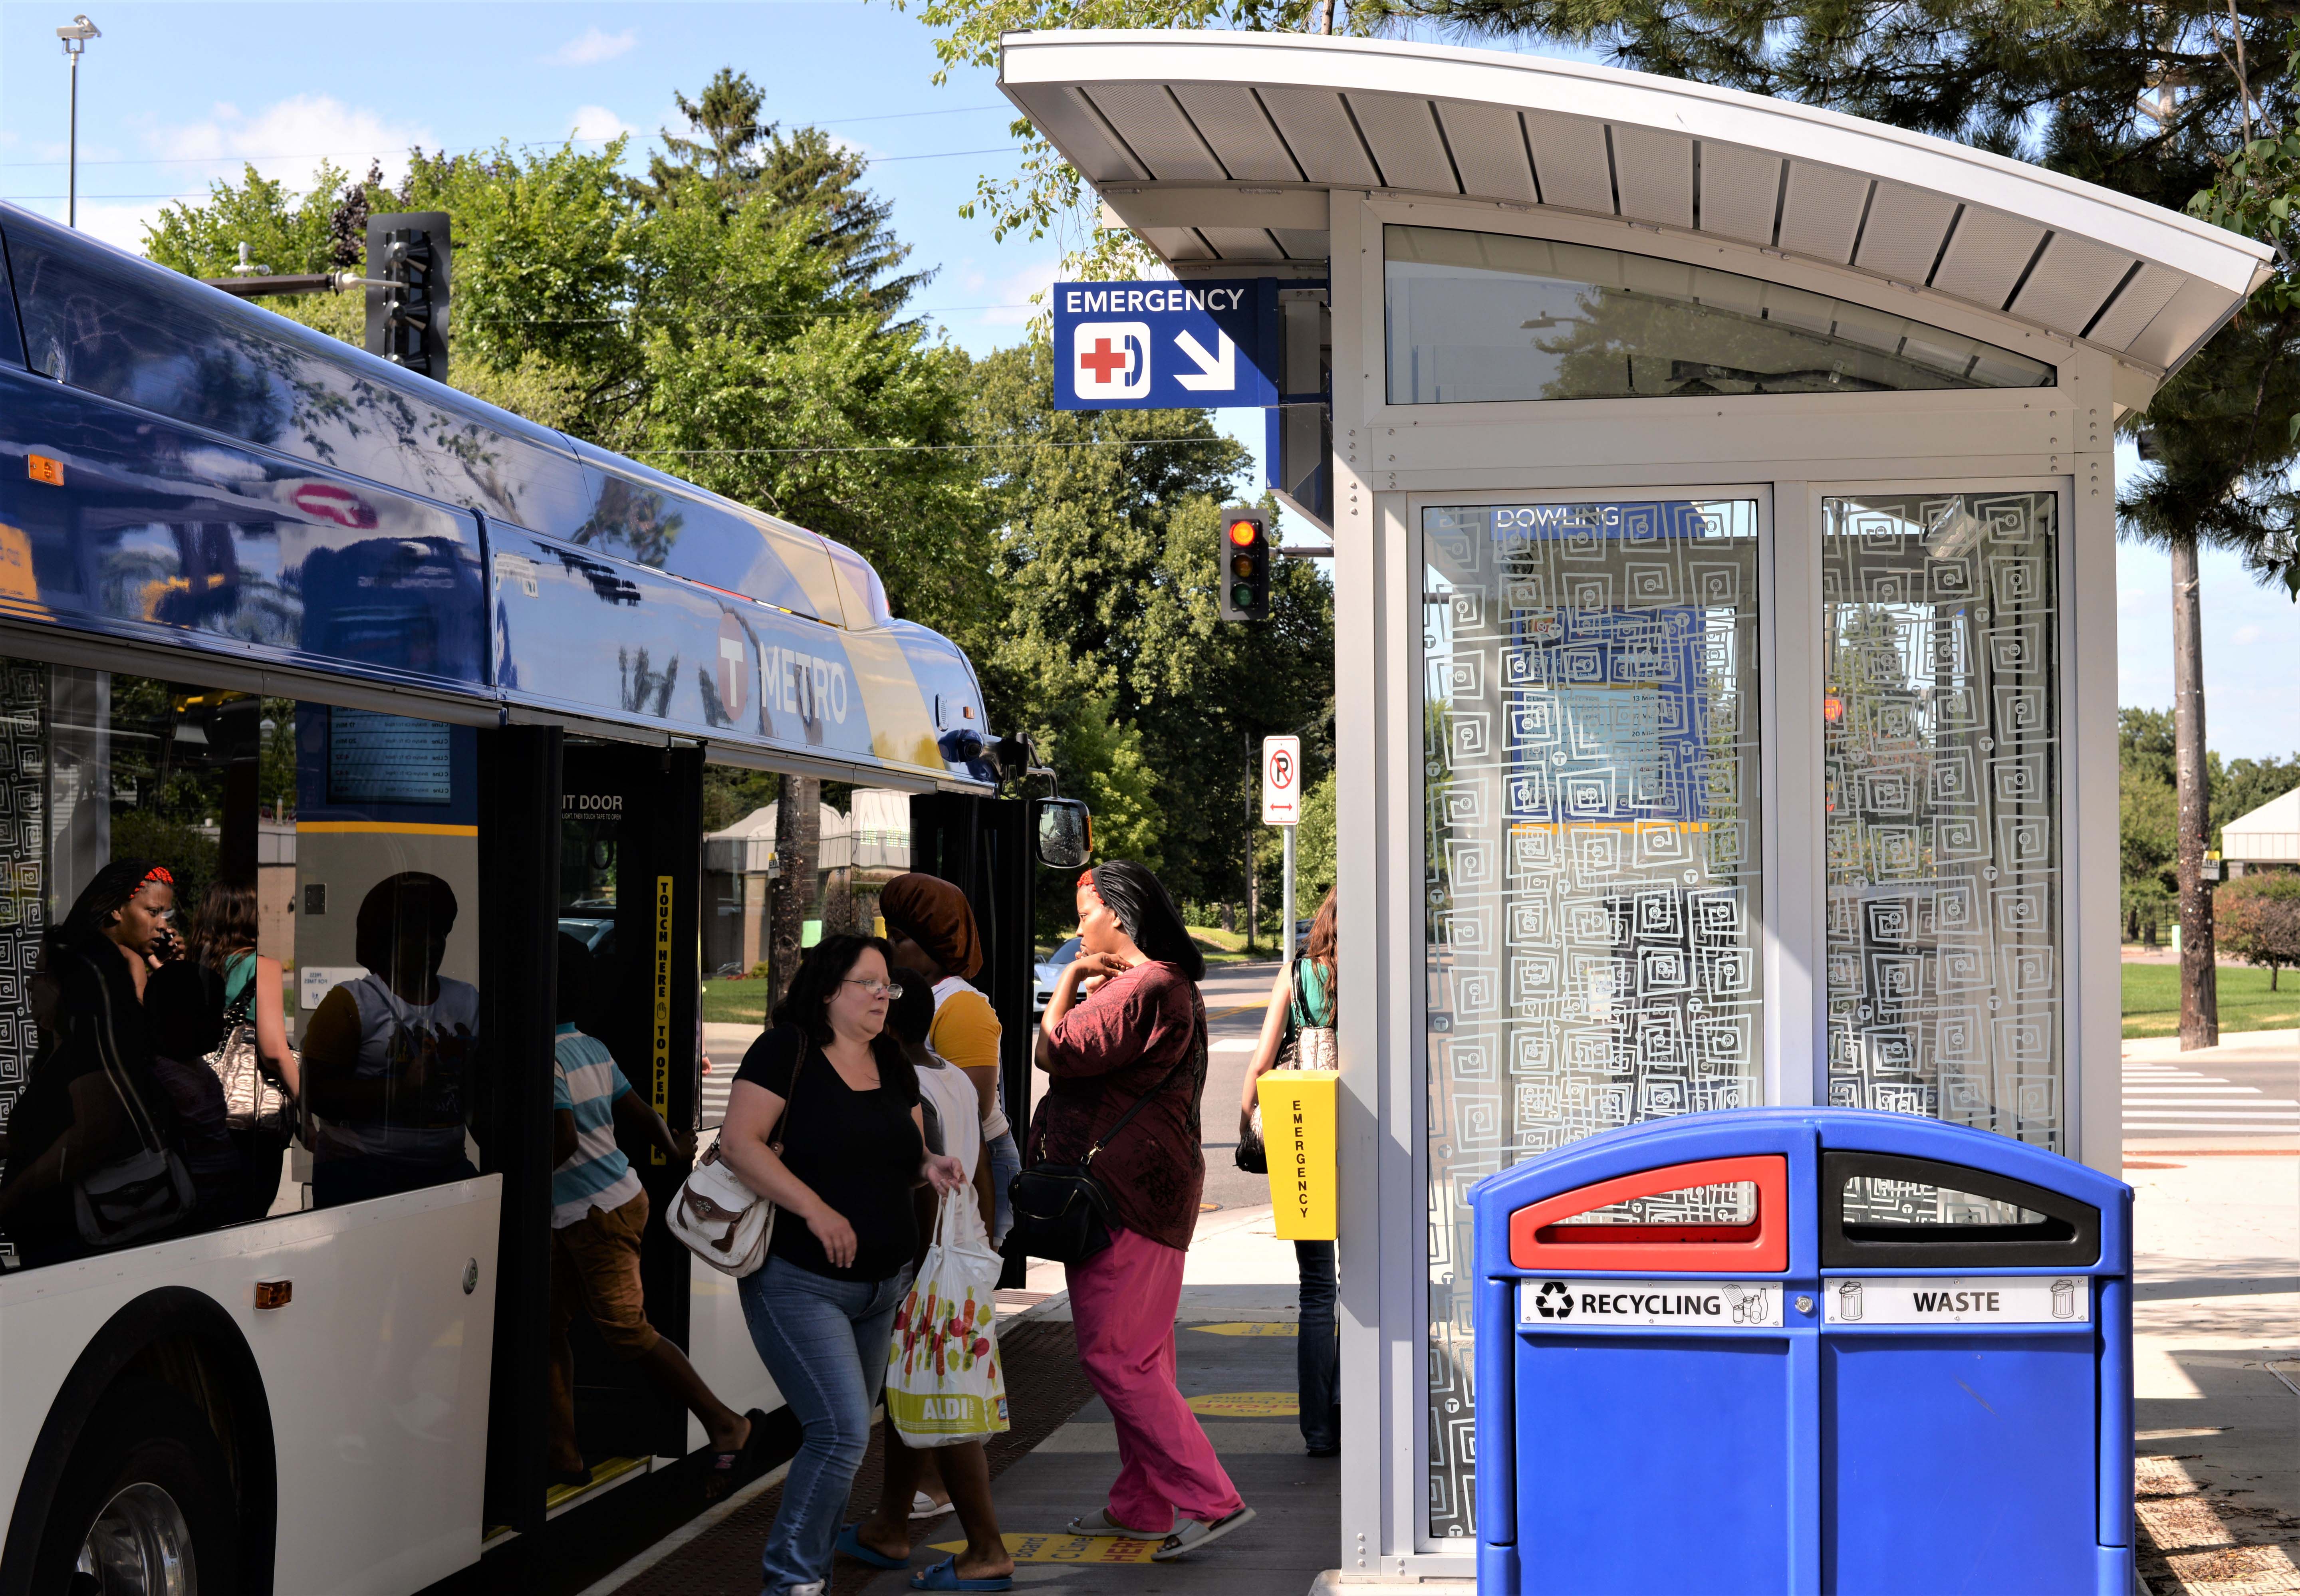
Photo: Metro Transit
Among the metropolitan areas with the most significant positive changes, Phoenix (+8.1%) and Los Angeles (+6.0%) showed a mix of positive accessibility changes from both transit investments and land use; Raleigh (+6.8%) showed accessibility increases primarily due to job growth and changes in job locations.
Among the metropolitan areas with significant negative changes, Baltimore (-8.9%) implemented the BaltimoreLink service redesign, which went into effect around February 4, 2018; Memphis’ (-7.7%) MATA implemented bus service changes in 2018; Cleveland’s (-5.2%) GCRTA experienced budget cuts in 2018; and Oklahoma City (-3.0%) experienced employment changes leading to lower accessibility.
Among the top 10 metro areas in 2019 for job accessibility by transit, New York, San Francisco and Chicago, respectively, again topped the list. The San Jose metro area rose to ninth place from tenth in a switch with Denver. Minneapolis ranked 12th, up from 13th in 2018.
Key factors affecting the rankings for any metro area include the number of jobs available and where they are located, the availability of transit service, and population size, density, and location.
This annual nationwide data is used to guide key transportation and land-use policy decisions. State departments of transportation, metropolitan planning organizations and transit agencies can apply the data to performance goals related to congestion, reliability and sustainability. In addition, detailed accessibility evaluation can help in selecting between project alternatives and prioritizing investments.
Transit is used for an estimated 5 percent of commuting trips in the United States, making it the second most widely used commute mode after driving. The commute mode share of transit can be higher in individual metropolitan areas: 31 percent in the New York metropolitan area; 11 percent in Chicago; eight percent in Seattle.
Maps of metropolitan areas with the greatest job accessibility by transit
More information
The research was sponsored by the National Accessibility Evaluation Pooled-Fund Study, a multi-year effort led by the Minnesota Department of Transportation and supported by partners including the Federal Highway Administration and additional state DOTs.