Access Across America: Transit 2018 Accessibility Maps
The following maps show summary accessibility data and maps for each of the metropolitan areas included in the study.
The maps show 30-minute accessibility values at the Census block level. Lighter colors indicate few jobs can be reached within 30 minutes; darker colors indicate more jobs can be reached within 30 minutes. At the highest levels, millions of jobs are accessible by transit within 30 minutes. Travel times include walking, waiting, riding, and transfers.
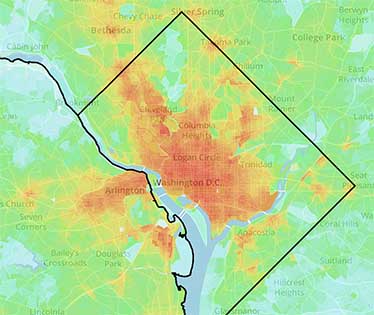
Accessibility map of Washington, DC
- New York
- San Francisco
- Chicago
- Washington
- Boston
- Los Angeles
- Philadelphia
- Seattle
- Denver
- San Jose
- Portland
- Milwaukee
- Minneapolis
- Baltimore
- Salt Lake City
- Miami
- Houston
- San Diego
- Dallas
- Pittsburgh
- Phoenix
- Las Vegas
- Austin
- Columbus
- Buffalo
- Hartford
- San Antonio
- Sacramento
- Cleveland
- New Orleans
- Providence
- St. Louis
- Atlanta
- Charlotte
- Tampa
- Indianapolis
- Detroit
- Louisville
- Cincinnati
- Kansas City
- Richmond
- Orlando
- Nashville
- Riverside
- Oklahoma City
- Raleigh
- Virginia Beach
- Jacksonville
- Birmingham
In addition to the top 49 metropolitan areas, the study includes accessibility maps for other metro areas in the National Accessibility Evaluation Pooled-Fund Study: