Access Across America: Auto 2018 Congestion Maps
The following maps show changes in job accessibility due to congestion for each of the metropolitan areas included in the study.
The changes are based on 30-minute accessibility values at the Census block level.
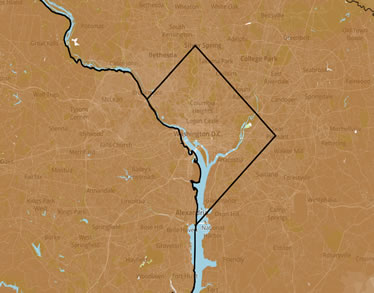
Congestion map of Washington, DC
- Los Angeles
- Riverside
- New York
- San Francisco
- Boston
- Atlanta
- Miami
- Washington
- San Jose
- Chicago
- Seattle
- Houston
- Philadelphia
- Baltimore
- San Diego
- Phoenix
- Portland
- Dallas
- Austin
- Providence
- Denver
- Tampa
- San Antonio
- Sacramento
- Nashville
- Orlando
- Pittsburgh
- Minneapolis
- Charlotte
- Detroit
- Jacksonville
- Raleigh
- New Orleans
- Hartford
- Columbus
- Cincinnati
- Milwaukee
- Birmingham
- Cleveland
- Indianapolis
- Las Vegas
- Salt Lake City
- St. Louis
- Virginia Beach
- Louisville
- Buffalo
- Kansas City
- Richmond
- Oklahoma City
- Memphis
In addition to the top 50 metropolitan areas, the study includes accessibility maps for other metro areas in the National Accessibility Evaluation Pooled-Fund Study: